Estonia's economy: software and the rock it burns
2 696 words · 12 min · updated 2026-09-10
 Back to Estonia
Estonia sells two things that have almost nothing in common: software written for customers who never arrive, and a sedimentary rock dug out of one north-eastern county and burned for electricity. The rock is oil shale, and as of 2013 it supplied about 70% of the country's primary energy and contributed about 4% of GDP in 2012. The software grew out of a state that put its own paperwork online in the 1990s and then sold that arrangement to foreigners. Both halves rest on a settlement assembled in a single decade, a currency board in 1992, a flat income tax in 1994 and no tax at all on profit a company keeps in the business, and every part of that settlement is now in motion at once.
In short
- GDP per head
- 34,418 United States dollars in 2025, 52,106 at purchasing power parity
- Growth
- 0.6% in 2025, after three years of decline
- Government debt
- 24.1% of GDP in 2025, projected 30.5% in 2027
- Reinvested profit
- Taxed at zero, the charge falling at distribution
- Flat income tax
- Adopted 1994 at 26%, reduced to 21% by 2008
- Oil shale
- About 73% of electricity, 4% of GDP in 2012
- Renewable electricity
- 38.9% in 2024, against 15.6% in 2016
- e-Residency
- Over 36,000 companies founded since 2014
What the Soviet economy left behind
Estonia has been industrialised twice, and the two industrialisations had almost nothing to do with each other. The first grew under Russian rule before 1914, when cotton spinning at Kreenholm in Narva ran alongside a knowledge sector at Tartu and an agricultural economy around both. The second was decided in Moscow.
After the declaration of independence in 1918 and the Treaty of Tartu in 1920, the new state inherited a wrecked economy and an inflated ruble. The Czarist ruble gave way to the Estonian mark, which circulated until 1927, and a stable currency, the kroon, was issued by the Bank of Estonia by 1929. The government confiscated the German landowners' estates, compensated the owners and divided the land into small farms, and those farms carried the interwar economy. Dairy and grain went west, with Germany and the United Kingdom as the main partners and only 3% of commerce going to the USSR. Estonian and Finnish living standards were then similar.
Annexation in 1940 and the destruction of the war ended that arrangement, and the occupation rebuilt the economy inside a centrally planned one. More than 56% of Estonian farms were collectivised during April 1949 alone, in the month after mass deportations to Siberia. Moscow expanded the industries with raw materials on the spot, oil shale and phosphorite, and sited the heavily polluting plant in the north-east from the early 1950s.
The country that reappeared in 1991 therefore had its heavy industry in one corner, its trade pointed east and its farmland in collective hands. Cleaning up took decades. By 2000 emissions were 80% smaller than in 1980, and the volume of unpurified wastewater discharged to water bodies 95% smaller.
How the kroon and the flat tax worked
In June 1992 the ruble was replaced by the kroon, backed by a currency board and pegged at 8 kroons to the German mark; when Germany adopted the euro the peg became 15.64664 kroons to one euro. A banking crisis followed in early 1992, out of liquidity problems and weaknesses carried over from the planned economy. It produced effective bankruptcy legislation, and privately owned banks emerged as the market leaders.
In 1994 Estonia adopted a flat income tax at 26% regardless of income, one of the first countries anywhere to do so, applying arguments associated with Milton Friedman. The rate came down in steps: 24% in 2005, 23% in 2006 and 21% in 2008. The Tallinn Stock Exchange opened as a fully electronic market in early 1996 and was bought by the Helsinki exchange in 2001. Estonia joined the World Trade Organization in 1999 and the European Union in 2004. Privatisation of state firms was substantially complete by the start of the century, with the ports and the main power plants left in government hands.
The catch-up that followed is measurable in one series. GDP per head stood at 35% of the average for the fifteen older European Union members in 1996 and at 65% of it in 2007. Output grew by 6.4% in 2000 and by 8% in 2007. Sweden and Finland supplied three fourths of external investment in the early 21st century, which is also where the export markets were, and that pairing of investor and customer still describes the Estonian trade position.
How the crash was answered without a bailout
The 2008 crisis arrived through a property bubble and a collapse in investment and consumption behind it. Growth was 0.1% in the first quarter of 2008, then negative: a fall of 1.4% in the second quarter, a little over 3% in the third and 9.4% in the fourth, followed by a further contraction of 15% in the first quarter of 2009. Industrial production fell by 34%. Unemployment went from 4% in May 2008 to 16% in May 2009, reached 18.8% during the crisis and settled at 13.8% by the summer of 2011.
The response was fiscal consolidation. The Riigikogu passed a supplementary negative budget cutting 2008 revenue by 6.1 billion kroons and expenditure by 3.2 billion, public salaries were cut across the board, and value added tax went from 18 to 20% in July 2009. The recorded deficit for 2009 came to 1.7% of GDP, and Estonia asked for no support from the International Monetary Fund. In December 2008 it had been a donor to the Fund-led rescue package for neighbouring Latvia.
Some of the later fall in unemployment has been attributed to emigration, to Finland, the United Kingdom, Australia and elsewhere. The euro replaced the kroon on 1 January 2011, the two circulating together until 14 January 2011. In August 2011 Standard and Poor's raised the country's rating from A to AA minus, citing confidence in an ability to sustain growth; growth that year was above 8%. In 2012 the budget was in surplus and government debt stood at 6% of GDP.
Why companies pay no tax on undistributed profit
Profit that an Estonian company reinvests carries no income tax at all. The charge falls when profit is distributed, which puts the timing of corporate tax in the hands of the owners and leaves a firm that ploughs its earnings back with nothing to pay on them. Privatisation is complete apart from the ports and the main power stations, the constitution requires a balanced budget, and foreigners face no restriction on buying bank shares or taking majority holdings.
That arrangement is also an export. The e-Residency programme, launched at the end of 2014, issues a state-backed digital identity to non-residents so they can found and run an Estonian company from anywhere. By mid-2025 it had attracted more than 128,000 people from 185 countries, who had founded over 36,000 companies and generated 342 million euros in direct economic impact. The programme produced 68 million euros of direct state income in the first six months of 2025, against 66.8 million euros for the whole of 2024: 26.2 million from labour taxes, 39.7 million from taxes on dividends and 2.1 million in state fees. Applications ran at 7,994 in that half year, 2,634 companies were registered, and a study found that e-residents paid 15.5 million euros to Estonian accountants, lawyers and virtual office firms in 2024.
Set against a gross domestic product of 47.0 billion United States dollars in 2025, those are small sums. What they measure is a jurisdiction sold as a service, and it is the same jurisdiction Estonian residents use.
What Estonia makes and grows
Manufacturing contributed 15.4% of GDP in 2018, employed around 124,000 people and accounted for a fifth of that year's growth. The sector counted 7,981 enterprises, 8% of all businesses in Estonia, employing over 107,000 people or 22% of everyone in work. It is built from small firms: 78% of manufacturers employ fewer than ten people, and 3%, some 215 firms, employ more than a hundred.
By share of output in that same account, machinery is about a quarter, wood and paper a fifth, food processing 15%, metalworking 13%, chemicals 10% and light industry under 5%. Over 60% of what the sector makes is exported. In 2018 its exported goods came to 10.4 billion euros, 72% of all merchandise leaving the country. Finland and Sweden are both the main markets and the source of more than 60% of foreign direct investment into Estonian manufacturing, which ties factory orders in Estonia to demand across the gulf.
Farming shrank quickly and then consolidated. Agriculture fell from 15% of GDP in 1991 to 3.3% in 2000, and from 15% of employment to 5.2% over the same years. Cultivated land has grown since: about 1.05 million hectares of arable land and 0.24 million hectares of natural grassland were recorded by 2019, the average holding was 62 hectares, and 78% of farmland was worked by entities holding at least 100 hectares each.
| Crop | Production, 2018 |
|---|---|
| Wheat | 450,000 tonnes |
| Barley | 347,000 tonnes |
| Rapeseed | 113,000 tonnes |
| Potatoes | 88,000 tonnes |
| Oats | 78,000 tonnes |
| Peas | 53,000 tonnes |
| Rye | 29,000 tonnes |
The forests are the other primary industry and the argument about them is about volume. The government holds an annual harvest threshold of at least 9.5 million cubic metres, inventories indicate over-harvesting, and logging has increased on private and protected land alike since at least 2009. The International Energy Agency records that Estonian forests, which used to offset a large share of national emissions, have become a net source of them.
Why software became the second export
The state wired itself first. Tiigrihüpe, begun in the middle of the 1990s, put computers and network connections into schools, and the administration followed: filing a tax return takes under five minutes and 98% of banking transactions are conducted over the internet. What internet voting did for elections, the same infrastructure did for company registration and tax.
The firms came out of that. Skype, Bolt, Wise, GrabCAD and Fortumo were all founded in Estonia, and a count in January 2022 put the number of startups at 1,291, in a country whose population was 1,369,995 on 1 January 2025. Services account for 68.1% of GDP and 76.8% of employment after the shift of the 2000s, and more than half of GDP is generated in Tallinn, which is also where the banks sit, Swedbank and SEB Pank and Nordea among them.
Wages have moved with it. The average monthly gross wage was 980 euros in 2013 and 2,213 euros in June 2025. The whole economy has around 600,000 employees, employers report a shortage of skilled labour, and the working visa quota for citizens of countries outside the European Economic Area has been raised in response, and that increase has been criticised as inadequate to the shortage. Spending on research and development was about 1.5% of GDP as of 2015, against a European Union average near 2.0%.
How Estonia powers itself and what that costs
What burning oil shale still pays for
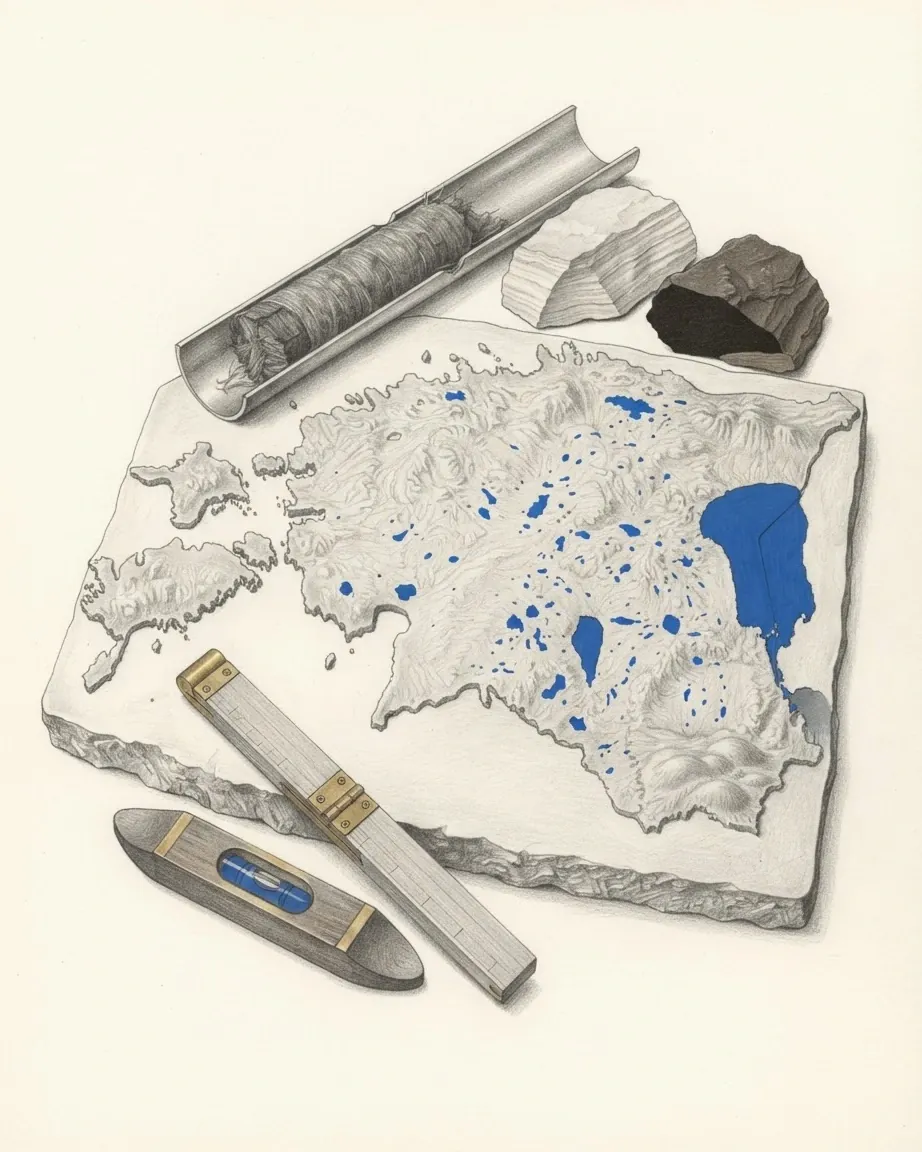
Oil shale is the mineral the Estonian energy system was built on, and the reason the north-east looks as it does. The industry sits in Ida-Viru County and produces around 73% of Estonian electricity; as of 2013 it supplied roughly 70% of total primary energy, and it contributed about 4% of GDP in 2012. Generation of electricity and heat sits largely with the state-owned Eesti Energia, and the stations that matter are at Narva. Shale is refined into oil as well as burned, and that output has been rising.
The costs sit on the same ground as the mines. Sulphur dioxide emissions per person are almost as high as in the Czech Republic, groundwater pollution from mining and seawater pollution along the eastern coast are both on the record, and the phosphorite industry has drawn the same objections. Tailings at Sillamäe, left by more than fifty years of uranium ore, shale and loparite mining and processing, hold rare-earth oxides that are now worth extracting.
Gas was the other inheritance. Estonia prohibited imports of Russian pipeline gas in 2023, after a decade in which Russian gas had been the whole of national consumption. Gas use came to 3.42 TWh in 2023, against a strategic reserve of 1 TWh held in the Inčukalns underground storage in Latvia, about 29% of average annual needs. The energy dependency rate, the share of energy consumed that has to be imported, was 4.6% in 2024.
How the electricity mix has changed
Renewable sources generated 38.9% of Estonian electricity in 2024, against 15.6% in 2016, and renewables were 42.2% of gross final energy consumption in 2024 against 29.2% in 2016. Primary energy production came to 170,912 terajoules in 2024, 11.3% below the year before, with final consumption at 119,131 terajoules.
| Renewable electricity, GWh | 2016 | 2020 | 2024 |
|---|---|---|---|
| Wood chips and waste | 815 | 1,730 | 1,322 |
| Wind | 594 | 844 | 1,164 |
| Solar | 10 | 245 | 1,032 |
| Hydro | 35 | 30 | 30 |
Solar generation went from 10 GWh in 2016 to 1,032 GWh in 2024 and wind from 594 to 1,164 GWh over the same eight years, while the wood-fired total peaked in 2020. Offshore capacity is being auctioned: in the summer of 2024 the Norwegian firm Deep Wind Offshore won the Saare 2.1 and 2.2 auctions for more than 1 GW of capacity, with Sunly and Valorem joining the consortium renamed Tuul Energy, and in January 2025 Oxan Energy won an auction for a floating wind farm 60 kilometres west of Saaremaa. The electricity market was liberalised in 2013 and integrated into the Nord Pool exchange. The International Energy Agency records a target of covering the whole of annual electricity demand from renewables by 2030 and reaching climate neutrality by 2050, alongside its finding that oil shale remains the main energy source.
Why growth stopped after the invasion
The pandemic recession was followed by 8.6% growth in 2021. Then GDP fell by 1.3% in 2022 after the Russian invasion of Ukraine, inflation reached 24% before dropping back to single digits in 2023, and output declined for three consecutive years. The European Commission's forecast of May 2026 records growth of 0.6% in 2025 as the end of that run, with 1.6% projected for 2026 and 1.7% for 2027.
The mechanism is the one the trade figures describe. Demand among the Nordic partners was subdued, exports grew slowly while Estonian firms looked for other markets, and imports are set to outpace them because most defence equipment is bought abroad. Inflation was 4.8% in 2025 on the World Bank series, and the Commission projects 4.4% for 2026 and 2.9% for 2027.
The labour market reading depends on which series is used. The World Bank recorded unemployment at 8.3% for 2025; the Commission, working from the quarterly labour force survey, put it at 7.4% in the third quarter of 2025 and 6.5% in the fourth, and projects 7.1% for 2026. Part of the fall is a shrinking labour force in a country whose population was falling by 0.4% a year as of 2025. GDP per head was 34,418 United States dollars in 2025, or 52,106 dollars measured at purchasing power parity, and the Gini coefficient stood at 30.7 in 2023.
What the state now borrows for
The public deficit stood at 2.0% of GDP in 2025. Revenue that year rose on higher personal and corporate income tax rates, a value added tax increase and a new motor vehicle tax, and expenditure rose faster on public investment. For 2026 the Commission projects a deficit of 4.5% of GDP and for 2027 one of 4.8%, which would carry government debt from 24.1% of GDP in 2025 to 30.5% in 2027.
Most of the 2026 increase is defence spending, set to reach 5% of GDP, with Rail Baltica and other investment projects behind it. On the revenue side a universal tax exemption and a flat tax-free allowance of 700 euros a month from 2026 reduce personal income tax receipts, partly offset by value added tax collected on higher prices.
The old settlement is visible in what is being spent. A constitution requiring a balanced budget, debt at 6% of GDP in 2012 and a refusal of the Fund's money in 2009 produced a balance sheet with room on it, and that room is now going into defence and rail. Meanwhile the oil price spike of 2026 has restarted shale oil production, which the Commission expects to add to growth that year, so the rock and the software are both still in the accounts.
Common questions
Questions about Estonia
What is oil shale, and why does Estonia burn it?
Oil shale is a sedimentary rock rich enough in organic matter to burn, and Estonia has large deposits of it in Ida-Viru County in the north-east. Soviet planners expanded the industry because the raw material was local, and it still produces around 73% of Estonian electricity. As of 2013 it supplied about 70% of total primary energy, and in 2012 it contributed about 4% of GDP. The rock is also refined into shale oil.
Does Estonia really charge no corporate income tax?
Profit that a company keeps in the business is untaxed. Estonian corporate income tax falls when profit is distributed to owners rather than when it is earned, so a firm reinvesting its earnings pays nothing on them in the year they are made. The flat personal income tax dates from 1994, when it was set at 26% regardless of income, and it was reduced in steps to 21% by 2008.
What is e-Residency, and what does it earn?
It is a state-issued digital identity for non-residents, launched at the end of 2014, which allows a foreign national to found and run an Estonian company remotely. By mid-2025 more than 128,000 people from 185 countries held one and had founded over 36,000 companies. The programme brought the state 68 million euros of direct income in the first half of 2025, against 66.8 million euros for all of 2024.
Why did the Estonian economy shrink after 2021?
Output grew 8.6% in 2021, fell 1.3% in 2022 and then declined for three consecutive years. Inflation reached 24% before returning to single digits in 2023, energy costs rose, and demand in the Nordic markets that buy most Estonian manufacturing output stayed weak. Growth of 0.6% in 2025 ended the run, and the European Commission projected 1.6% for 2026.
What does Estonia sell abroad?
Electrical equipment, wood and wooden articles, food and agricultural products, mineral products and transport equipment, with services and software alongside them. Manufacturing exported goods worth 10.4 billion euros in 2018, 72% of all merchandise exports, and over 60% of what the sector makes leaves the country. Finland and Sweden are the main markets and the main source of foreign investment in Estonian factories.